![]() Learning Objectives
Learning Objectives
![]() Introduction
Introduction
![]() Tutorial
Tutorial
A quadratic function is a function that
can be written in the form
![]()
where a, b,
and c
are constants and ![]()
![]()
if a > 0, then the parabola opens up ![]() ,
,
if a < 0, then the parabola opens down ![]() .
.
Finding the vertex using the form ![]() ,
, ![]() :
:
vertex =![]() .
.
Basically you will find the x value of the vertex first and then just plug that value into the function to get the y or functional value of the vertex.
Finding the vertex using the form ![]() :
:
vertex = (h, k).
Axis of Symmetry
Think of it as a mirrored image about this vertical line.
I want you to note a few things about this
graph:
Second, look at the axis of symmetry. It is not actually part of the graph itself, but is important in that the parabola creates a mirrored image about it. Note how it is symmetric about the axis of symmetry. Also, note how it goes through the vertex.
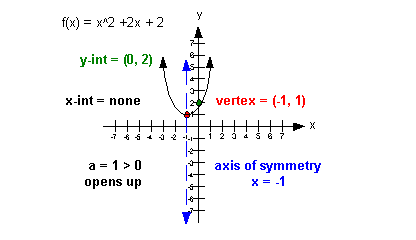
Third, note how there is one y-intercept
but no x-intercept. The quadratic
function can have no, one or two x-intercepts.
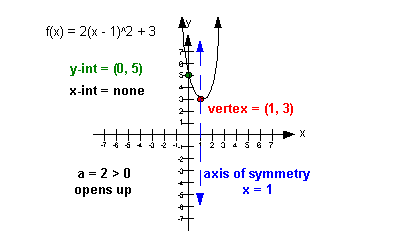
I want you to note a few things about this
graph:
Second, look at the axis of symmetry. It is not actually part of the graph itself, but is important in that the parabola creates a mirrored image about it. Note how it is symmetric about the axis of symmetry. Also, note how it goes through the vertex.
Third, note how there is one y-intercept
and one x-intercept. The quadratic
function can have no, one or two x-intercepts.
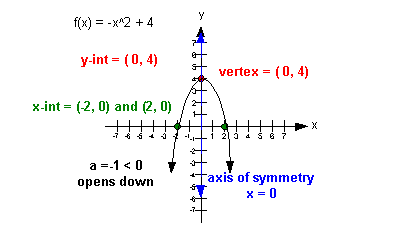
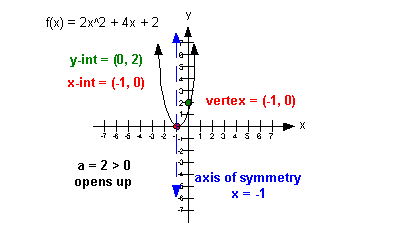
I want you to note a few things about this
graph:
Second, look at the axis of symmetry. It is not actually part of the graph itself, but is important in that the parabola creates a mirrored image about it. Note how it is symmetric about the axis of symmetry. Also, note how it goes through the vertex.
Third, note how there is one y-intercept
and two x-intercepts. The quadratic
function can have no, one or two x-intercepts.
 Example
1: Find the coordinates of the vertex of
Example
1: Find the coordinates of the vertex of 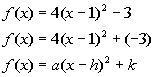
*Standard form of quad. function
If you said (1, -3) you are correct.
Be careful about your signs on this problem. It is real tempting
to say that the vertex is (1, 3). However take a close look at the
standard form. Notice how the sign in front of h is a minus, but the one in front of k is positive.
So h is the number we are subtracting from x,
which in our case is 1. k is the number
we are adding at the end, which our case we are adding a negative 3.
If we know which direction the curve opens, that can help us answer this question.
Since a = 4, and 4
is greater than 0, this parabola would open up ![]() .
.
So does that mean the vertex is a maximum or minimum point?
If you said a minimum point, you are right on.
So our vertex (1, -3) is the minimum point.
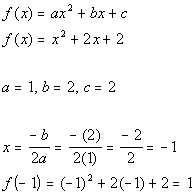
Example
2: Find the coordinates of the vertex of 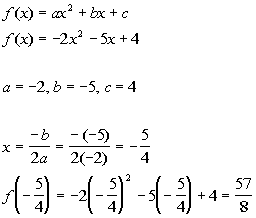
*Identify a, b,
and c
*Plug values into vertex form. for a, b,
and c
*Plug -5/4 in for x to find the y value of the vertex
If we know which direction the curve opens, that can help us answer this question.
Since a = -2, and
-2 is less than 0, this parabola would open down ![]() .
.
So does that mean the vertex is a maximum or minimum point?
If you said a maximum point, you are right on.
So our vertex ![]() is the maximum point.
is the maximum point.
Graphing a Quadratic Function
Example
3: Use the vertex and the intercepts to sketch the graph of
the quadratic function This gives us a good reference to know we are going in the right direction.
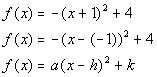
If you said (-1, 4) you are correct.
Be careful about your signs on this problem. Notice how
the sign in front of h is a minus, but the
one in front of k is positive. So h is
the number we are subtracting from x, which
in our case is -1. k is the number we
are adding at the end, which our case we are adding a 4.
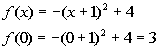
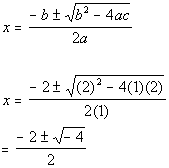
x-intercept
Reminder that the x-intercept is always
where the graph crosses the x-axis which means y = 0:
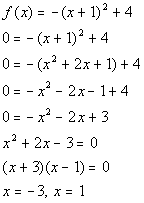
*Solve
the quadratic by factoring
 Example
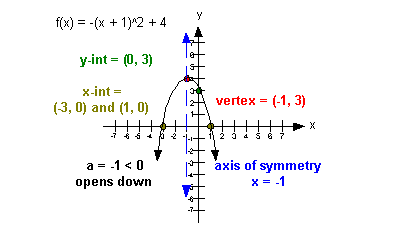
4: Use the vertex and the intercepts to sketch the graph of
the quadratic function
Example
4: Use the vertex and the intercepts to sketch the graph of
the quadratic function This gives us a good reference to know we are going in the right direction.
*Identify a, b,
and c
*Plug values into vertex form. for a, b,
and c
*Plug -1 in for x to find the y value of the vertex
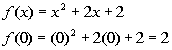
x-intercept
Reminder that the x-intercept is always
where the graph crosses the x-axis which means y = 0:
*Plug in values for a, b,
and c
![]() Practice Problems
Practice Problems
To get the most out of these, you should work the problem out on your own and then check your answer by clicking on the link for the answer/discussion for that problem. At the link you will find the answer as well as any steps that went into finding that answer.
Practice Problems 1a - 1b: Find the coordinates of the vertex of the given quadratic function. Without graphing, determine if the vertex is the maximum or minimum point of the quadratic function.
![]() Need Extra Help on these Topics?
Need Extra Help on these Topics?
The following is a webpage that can assist you in the topics that were covered on this page:
![]()
Last revised on July 10, 2010 by Kim Seward.
All contents copyright (C) 2002 - 2010, WTAMU and Kim Seward. All rights reserved.